

TopTradeTools – Tick Trader Bundle
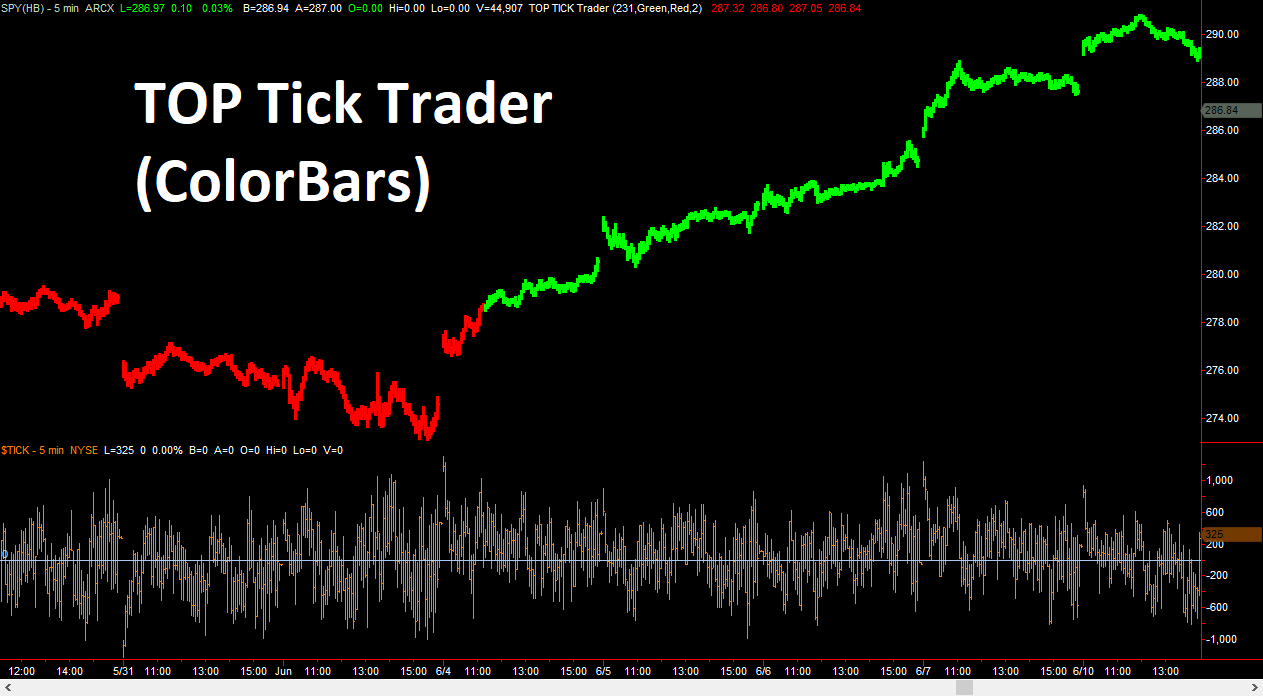
The TOP Tick Trader (ColorBars) indicator has been designed to provide professional traders with the clearest picture of the stock market internals through the NYSE $TICK data, which tracks broad-based real-time stock market buying and selling activity. Finding trades is now made as easy as green bars “Buy” or red bars “Sell Short.”
Designed for trading Stocks, ETFs, and Options with a focus on the major stock market indices including the S&P 500 (SPY), Dow Jones Industrial Average (DIA), NASDAQ (QQQ), and the Russell 2000 (IWM). TOP Tick Trader is a powerful tool that can be used for Day Trading, Swing Trading, and for strategic Trend Trading! Designed to focus on intraday charts, including 1-minute charts, 5-minute charts (recommended), 15-minute, 30-minute, and 60-minute charts, to name a few.
Most professional traders agree that a clear picture of the stock market internals is perhaps the best measure of stock market sentiment. Giving traders a clear view of broad-based buying and selling activity in the stock market. Which can be a powerful predictor of future price moves. The Tick Trader communicates the live broad-based trading actions of buyers and sellers in the stock market. Subtle changes in broad market buying. And selling activity can provide powerful clues that the stock market is about to take off or possibly reverse direction. The TOP Tick Trader indicator has been designed to give professional traders a powerful advantage when trading stock market indices like the S&P 500, Dow Jones Industrial Average, NASDAQ, and the Russell 2000. The recommended bar interval is the 5-minute charts for Day Trading, Swing Trading, and even for strategic entry trend trading.
Also Get TopTradeTools – Tick Trader Bundle on Traderknow.com
Easy to Read Shifts in Demand
When the buyers become more active in the stock market, prices typically go up. When sellers become more active in the stock market, prices typically go down. By tracking and displaying changes in the NYSE $TICK indicator market internals. The TOP Tick Trader makes it easy for you to see whether the buyers are stronger, or the sellers are stronger. When the stock market is experiencing broad-based buying. The TOP Tick Trader turns green, to indicate that the buyers are stronger and are in control. When the stock market is experiencing broad-based selling. Also the TOP Tick Trader turns red, to indicate that the sellers are stronger.
Also Get TopTradeTools – Tick Trader Bundle on Traderknow.com
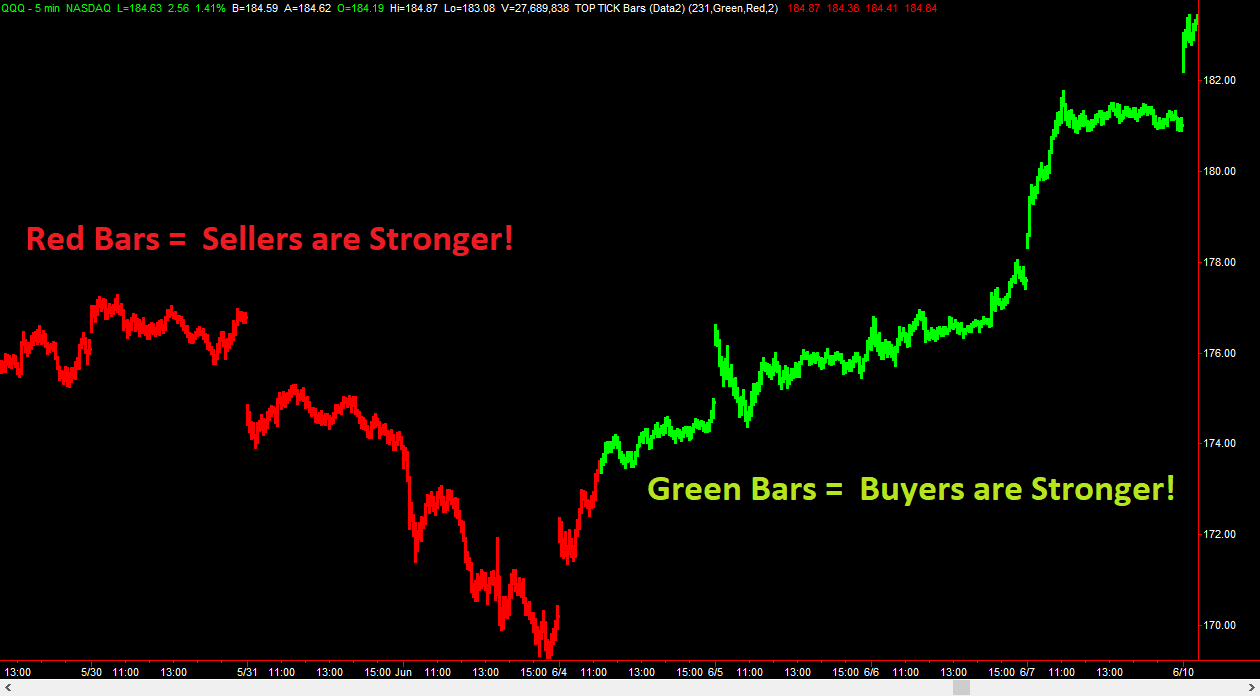
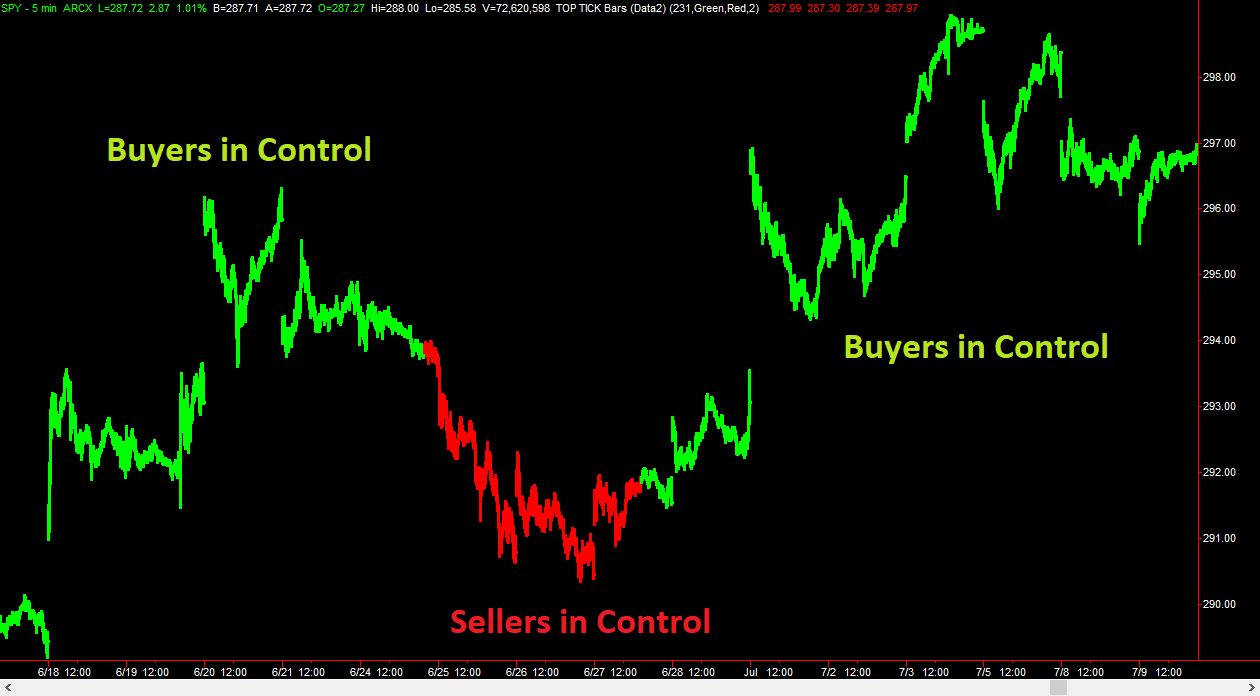
In the QQQ (NASDAQ ETF) 5-minute chart example above, you can clearly see how the TOP Tick Trader indicator shows us when the buyers are in control by painting the price bars green and when the sellers are in control by painting the price bars red. Using the powerful NYSE $TICK market trading data to detect broad-based buying or broad-based selling in the stock market, we can now jump on the side of the buyers (demand) when price bars are green or jump on the side of sellers (supply) when price bars are red.
Risk Disclaimer: There is a risk of loss in trading and past performance is not necessarily indicative of future results.
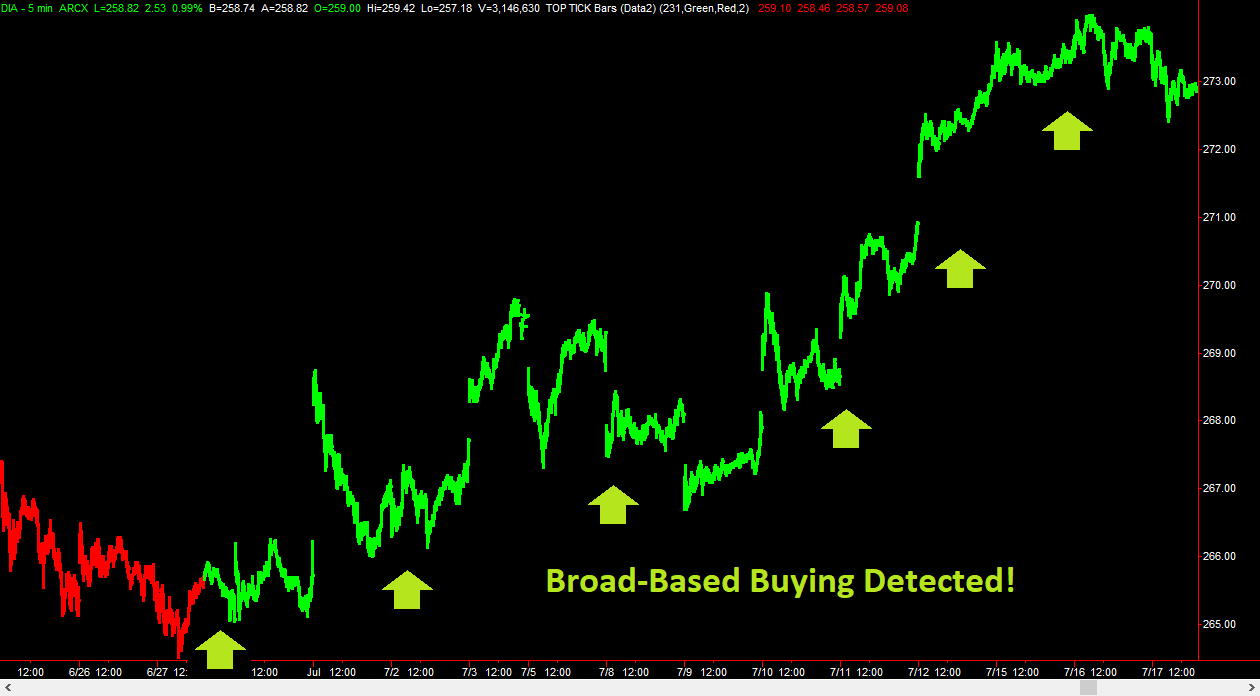
Many traders believe that the NYSE $TICK data, which is us ed by the TOP Tick Trader, is one of the best market sentiment indicators available. When market sentiment changes quickly, you need to be able to react quickly. Your ability to react quickly to changing market sentiment may be the difference catching big moves or missing out!
In the DIA (Dow Jones Industrial Average ETF) chart above, you can clearly see that the TOP Tick Trader shifts from red to green early on in the chart, indicating that the control has shifted from the sellers to the buyers. Once buyers took control, prices in the DIA proceed to rally from 266 all the way to 273! More demand and more buying activity typically results in higher prices.
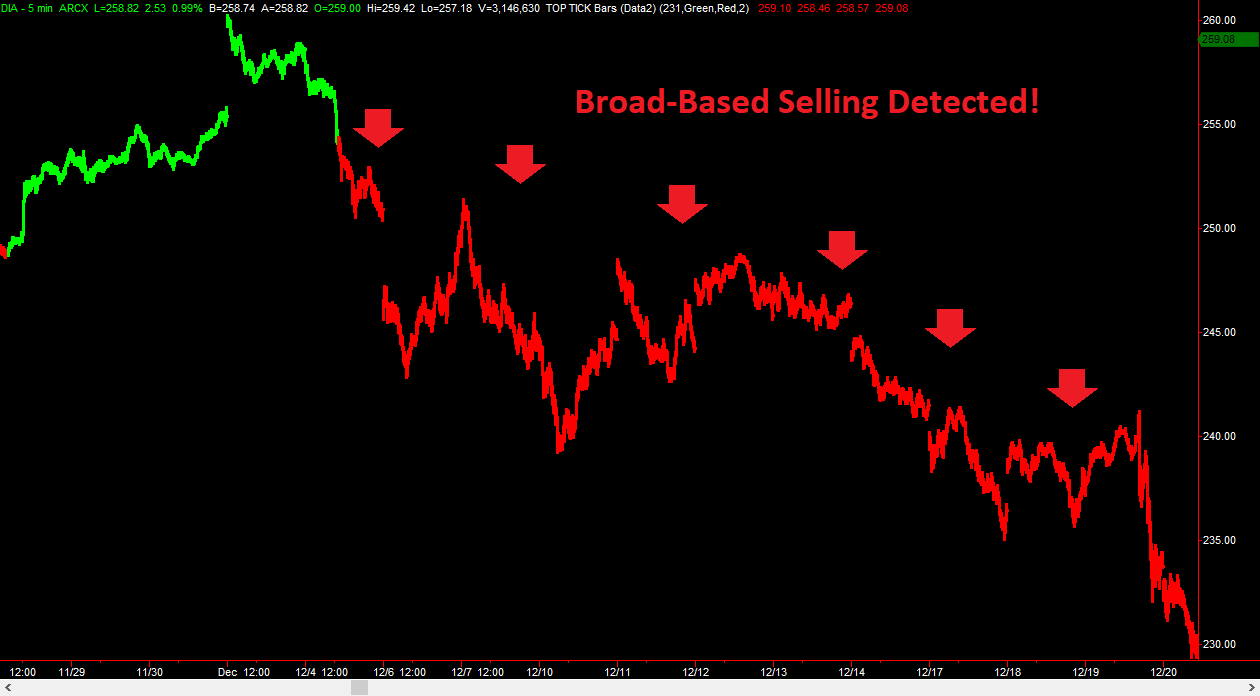
On the flip side, when broad-based selling is detect ed, the TOP Tick Trader turns red, alerting us to exit our long positions and look to join the sellers by selling short! You can see in the DIA 5-minute chart above prices get hammer ed after the sellers kick in (red bars), sending prices falling from 255 all the way to 230.
Also Get TopTradeTools – Tick Trader Bundle on Traderknow.com
Trade the S&P 500, Dow Jones, NASDAQ, and Russell 2000 ETFs
The TOP Tick Trader gives you a powerful addition to your trading toolbox. By tracking the market internals, broad-based buying power in the stock market based on the NYSE $TICK, you can track and trade on the side of the dominant force – the buyers (green bars) or the sellers (red bars).
Regardless of the stock index you are trading, the TOP Tick Trader alerts you when the buyers are in control or when the sellers are in control, making the TOP Tick Trader an indicator you can use to signal when to buy or sell short the stock market.
Risk Disclaimer: There is a risk of loss in trading and past performance is not necessarily indicative of future results. Review the Hypothetical risk disclaimer RULE 4.41 at the bottom of the page.
Also Get TopTradeTools – Tick Trader Bundle on Traderknow.com
Visit more course: FOREX TRADING COURSE
The same course: Bill Williams Eduard Altmann SMB Simpler Trading Van Tharp Atlas Api Training Trading Template Sunil Mangwani Sunil Mangwani Frank Paul . Also Market Delta Tradingacademy Simplertrading Urbanforex. Also Candlechartscom Dan Sheridan Pipsociety Atlas Api Training TopTradeTools Todd Mitchell Jerry Singh OpenTrader Alexandertrading Daytradingzones . wyckoffanalytics Simplertrading
Available at traderknow.com
Please contact email: [email protected] If you have any question.
Course Features
- Lectures 0
- Quizzes 0
- Duration 50 hours
- Skill level All levels
- Language English
- Students 87
- Assessments Yes