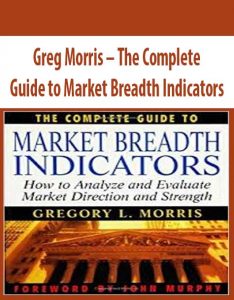
Greg Morris – The Complete Guide to Market Breadth Indicators
Market breadth indicators, i.e. advance/decline, new high/new low, or up/down volume, allow technical analysts and traders to look beneath the surface of a market to quantify the underlying strength or direction associated with a market move. Increasingly popular in all types of markets, they give traders the ability to accurately forecast a number of possible outcomes and the likelihood of each.
Bottom line? For gauging the near-term direction and strength of a market, breadth indicators are among the single most valuable tools a trader can use.
The Complete Guide to Market Breadth Indicators is the most comprehensive and vivid collection available of market breadth indicator information and features ideas and insights from market veterans including John Murphy, Don Beasley, Jim Miekka, Tom and Sherman McClellan, and numerous others. Chapters are first categorized based upon the mathematical relationship between the breadth pairs. Each indicator is then analyzed to provide information including:
- Also known as–other names by which the indicator is recognized
- Author/creator–when available
- Data components required–components of breadth data required to calculate the indicator
- Description--brief description of the indicator
- Interpretation–generally accepted industry interpretation of the indicator, with techniques of different analysts also discussed
- Chart--Chart or charts that best display the indicator
- Author comments–Greg Morris’s personal interpretation, opinion, and use of the indicator, along with suggested modifications, complementary indicators, and more
- Formula--An algebraic formula for the indicator or, for formulae that are too complex for this section, a descriptive narrative on the formula
- References–An indicator-specific bibliography for additional information on the indicator or its creator, with notes about a particular book or magazine article
Breadth analysis is one of the purest measures of market liquidity. Applicable to virtually any exchange or index of securities for which breadth data is available, it represents the best available footprint of the health and near-term direction of the overall market examined. The Complete Guide to Market Breadth Indicators is the first book to delve into the use, mathematics, and interpretation of the most popular and proven of these tools, and is an invaluable reference for technical traders and investors of all types, and in every market.
Also Get Greg Morris – The Complete Guide to Market Breadth Indicators on Traderknow.com
Visit more course: BOND – STOCK TRADING
Some BOND – STOCK course: Djellala – Training by Ebooks (PDF Files), Also StratagemTrade – Rolling Thunder: The Ultimate Hedging Technique. Also Tom K. eloyd – Successful Stock Signals for Traders and Portfolio Managers: Integrating. Also Daniel T.Ferrera Llewelyn James Martin Armstrong investorsunderground
Visit more course: FOREX TRADING COURSE
Some FX course: Bill Williams Eduard Altmann SMB Simpler Trading Van Tharp Atlas Api Training Trading Template Sunil Mangwani Sunil Mangwani Frank Paul . Also Market Delta Tradingacademy Simplertrading Urbanforex. Also Candlechartscom Dan Sheridan Pipsociety Atlas Api Training TopTradeTools Todd Mitchell Jerry Singh OpenTrader Alexandertrading Daytradingzones . wyckoffanalytics Simplertrading
Visit more course: FINANCIAL DEVELOPMENT
The same course: M.Rusydi Marc Yor Rene M.Stulz Robert Cinnamon Srdjan Stojanovic Stephen G.Ryan Steve Dalton . Also Sumru Altug Suresh Sundaresan Thomas Fitch Tom Taulli Lidiya K Tom Taulli Peter Dunkart. Also Jo Dunning Brendon Burchard Bob Bly Alex Becker Alan Weiss Talmadge Harper
Please contact email: [email protected] If you have any question.
Course Features
- Lectures 0
- Quizzes 0
- Duration 50 hours
- Skill level All levels
- Language English
- Students 51
- Assessments Yes


