Volume Breakout Indicator
Summary
This breakout indicator will detect directional breakouts on high volume. It analyzes the chart to find the times of day when volume and volatility are highest. For major forex pairs this normally coincides with the open of the London market. For commodities it’s usually the start of New York’s trading session.
The indicator will create a buy signal or a sell signal whenever a breakout event is detected during this period. The event time can also be overridden manually.
Example uses:
- Detecting breakouts at the open of London, Tokyo or New York trading sessions
- Trading breakouts on economic data, monetary policy statements and other news
- Trading breakouts at any regular time interval
- Analyzing market behavior and hourly volume/volatility
Directional Breakouts at Peak Volume
Breakout strategies suffer when there are a high proportion of false breaks. Instead of trading on every potential breakout, this indicator looks for the highest probability cases only. The strongest breakout events often happen when volume is rising sharply. These events are often around the opening of the major markets such as London, Tokyo and New York.
The indicator works as follows:
- On loading it will check the price history to find times of peak daily volumes.
- Displays the estimated peak volumes for each hour of the day
- Monitors price movements before and immediately after the peak volume time.
- Creates buy and sell alerts when a breakout has been detected.
This indicator only trades at one specific time of day – the time when volume and volatility is increasing sharply and where breakout events are usually strongest. This breakout strategy is designed for short duration trades only – day trades. The ideal timeframes are 5 minutes to 30 minutes.
Peak Volume
There aren’t any direct volume metrics available for foreign exchange. For this reason the indicator uses volatility analysis to predict times of day when volume is increasing or decreasing.
The graphic below shows volumes for the forex majors over a 24 hour period.
Figure 5: Peak volume analysis © forexop
Instead of having the indicator automatically detect peak volumes you can also manually override this and set any time to monitor. For example, this can be useful when trading breakouts on economic data releases.
For examples of volume breakout strategies see this page.
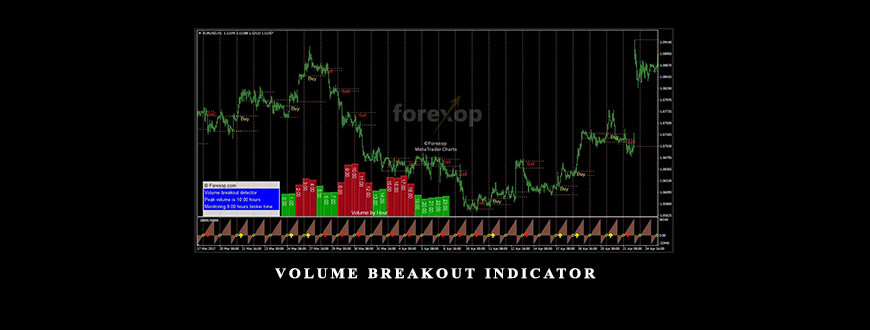
Figure 6: EURUSD 5M placing trades on indicator output signals © forexop
Compatible with Metatrader 4 and Metatrader 5.
Also Get Volume Breakout Indicator on Traderknow.com
Visit more course: FOREX TRADING COURSE
The same course: Bill Williams Eduard Altmann SMB Simpler Trading Van Tharp Atlas Api Training Trading Template Sunil Mangwani Sunil Mangwani Frank Paul . Also Market Delta Tradingacademy Simplertrading Urbanforex. Also Candlechartscom Dan Sheridan Pipsociety Atlas Api Training TopTradeTools Todd Mitchell Jerry Singh OpenTrader Alexandertrading Daytradingzones . wyckoffanalytics Simplertrading
Available at traderknow.com
Please contact email: [email protected] If you have any question.
Course Features
- Lectures 0
- Quizzes 0
- Duration 50 hours
- Skill level All levels
- Language English
- Students 198
- Assessments Yes


